


Read a table widget
Open the sub-units of a unit in a table widget and sort the rows by any column, so you can compare your units by the indicators of the widget.
Before you start
You need:
- Access to the Dashboard (Dashboard in the side menu)
- A widget on your Dashboard shown as a table
New to the app? Start with Sign in to the web app.
When to use it
When you want to compare units, their sub-units or their employees by the indicators of a widget.
Step by step
-
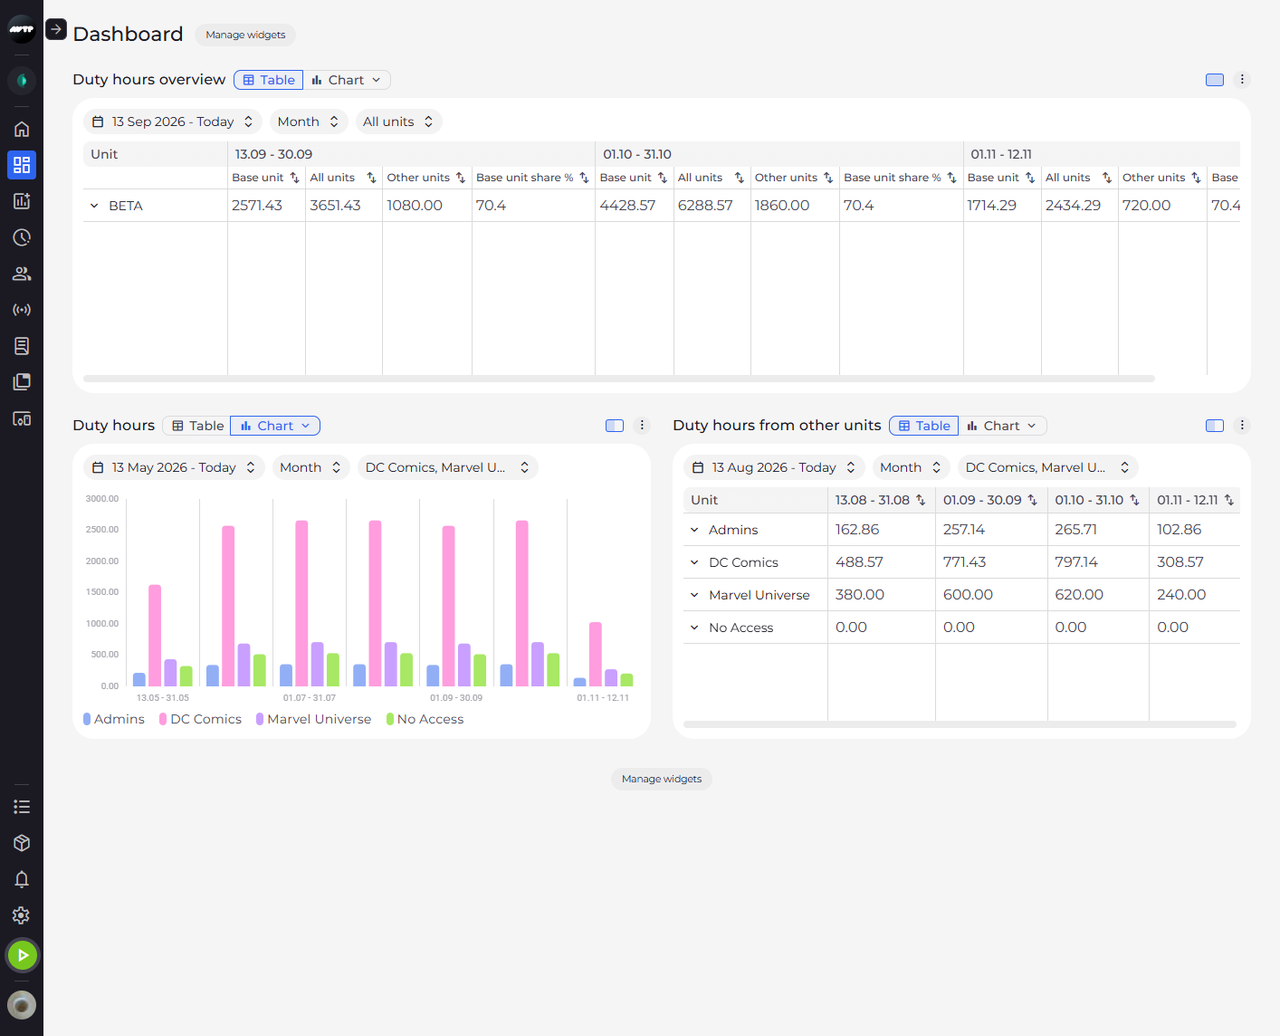
Step 1: A table lists the selected units with one column per indicator and period
Click Dashboard in the side menu. In a widget shown as a Table, the top header row names the periods, and under each period there is one column per indicator of the widget. The Unit column on the left names the units; scroll the table sideways to see the later periods.
-
Step 2: Click the arrow next to a unit to see its sub-units
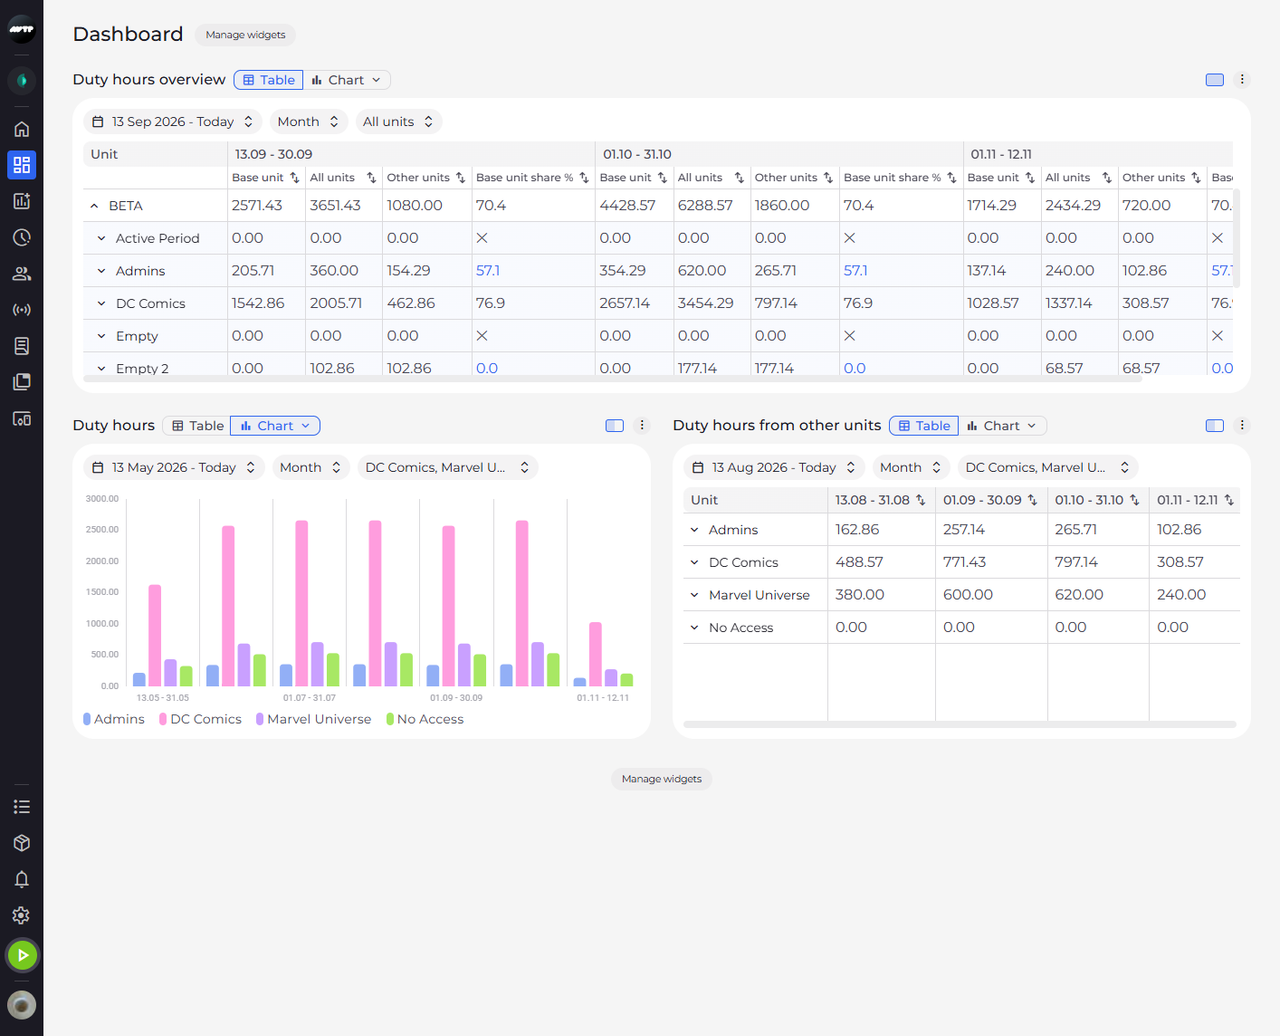
Click the arrow to the left of the main unit's name. Its sub-units are listed under it, each with an arrow of its own, and the arrow of the main unit now points up. Click it again to hide them.
Tip: At the lowest level, the arrow lists the employees with values in the period. Employees whose base unit it is are in bold, the others show their base unit in brackets.
Tip: If nobody under a unit has values in the period, the table says "No employees with values in this period" under it.
-
Step 3: Click a column's sort button to order the rows by it
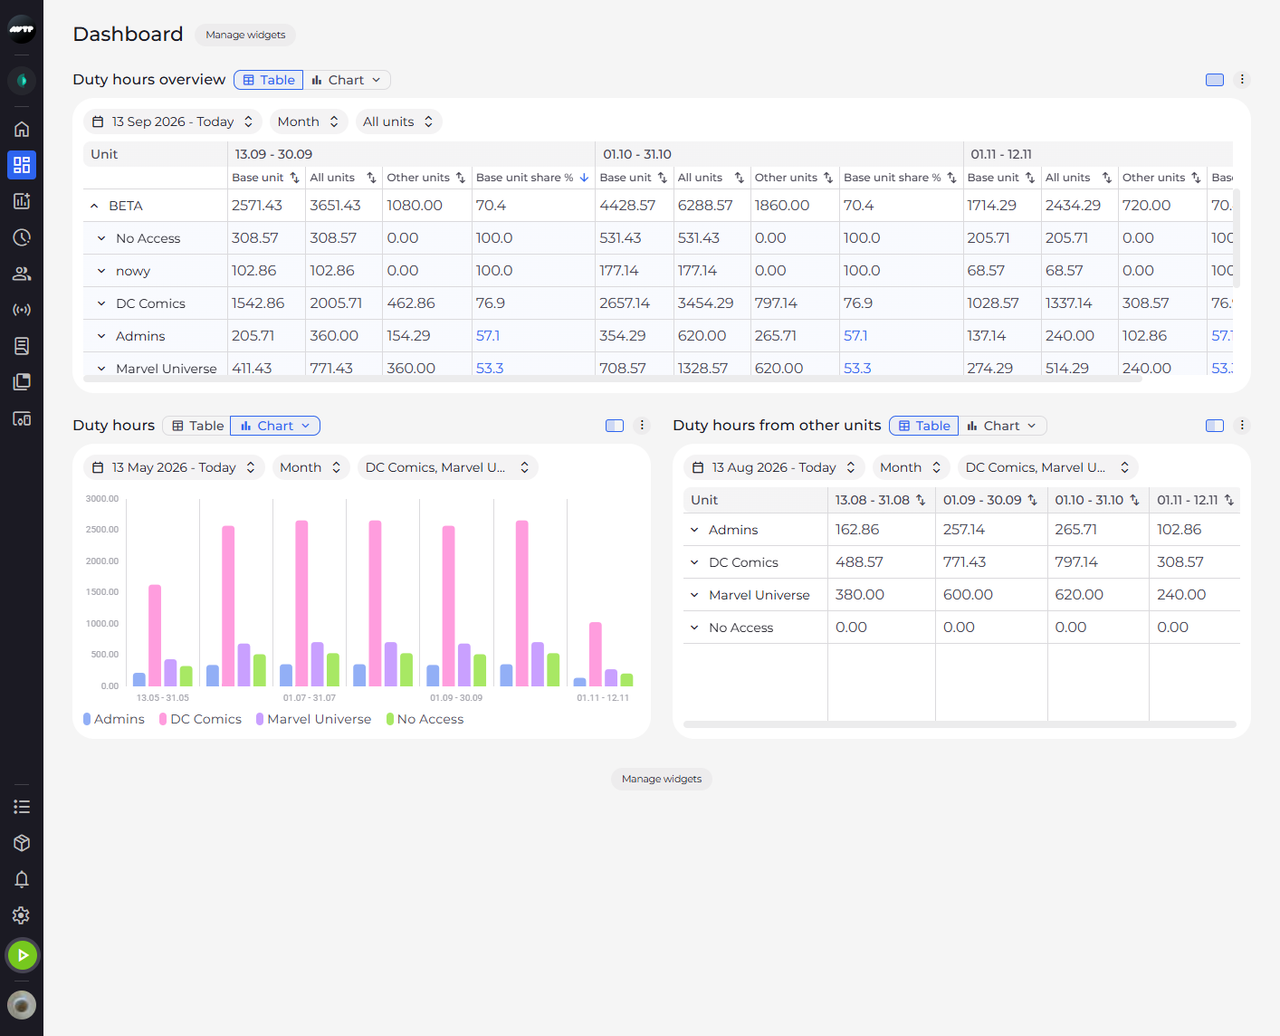
Click the sort button next to a column's name - the two small arrows. The button turns into a single blue arrow and the sub-units are reordered by the values in that column.
Tip: Each click on a sort button changes the order - highest values first, then lowest first, then back to the original order. The order is not saved and resets when you reload the page or change the widget.
Tip: Rows are sorted within their own level, so sub-units stay under their unit. Empty cells always go to the end.
What happens next
You see the sub-units of the unit under it, in the order of the column you sorted by.
Good to know
- A value in red is above the Max set for that indicator in Dashboard lists in Settings, a value in blue is below its Min. Point at the value to see "Above the maximum" or "Below the minimum".
- A cell showing ∞ or ✕ has no value for that period - point at it to see "Can't be computed for this period". Empty cells belong to periods that have not happened yet.